Core concepts
Oracles
What an oracle is, what is available to you, and why the names are what they are.
An oracle takes a request in plain language and returns an artifact that has passed
its checks. It is the unit you buy, the unit you call and the unit you are
billed for. Today chart, vector-graphics and coverage-policy each cost 1 credit per
answer, valid or invalid; an error is free.
Available to you
The console lists the oracles your organisation can call, read from the deployment rather than written here — so it cannot describe an oracle that is not actually served.
Real answers from chart, as they were returned:
A candlestick chart of a stock over 20 trading days: a thin rule from low to high and a bar from open to close for each day, green when close is above open and red when below. The price axis must not start at zero; scale it to the price range (about 95 to 125) so the candles are tall and readable.
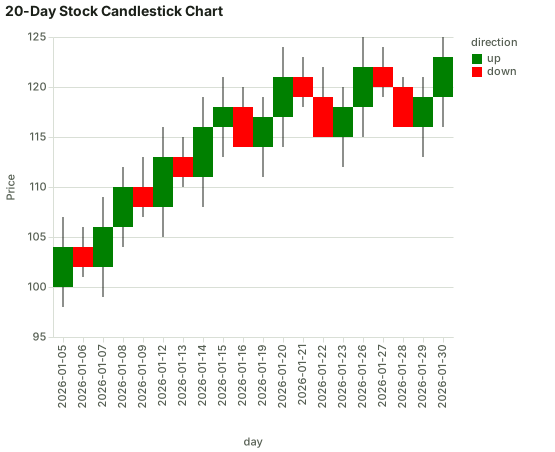
The result exactly as returned, in vega-lite — the source chart@6baf09f0 was checked against.
{
  "$schema": "https://vega.github.io/schema/vega-lite/v6.json",
  "name": "stock_candlestick",
  "data": {
    "values": [
      {
        "day": "2026-01-05",
        "low": 98,
        "open": 100,
        "close": 104,
        "high": 107,
        "direction": "up"
      },
      {
        "day": "2026-01-06",
        "low": 101,
        "open": 104,
        "close": 102,
        "high": 106,
        "direction": "down"
      },
      {
        "day": "2026-01-07",
        "low": 99,
        "open": 102,
        "close": 106,
        "high": 109,
        "direction": "up"
      },
      {
        "day": "2026-01-08",
        "low": 104,
        "open": 106,
        "close": 110,
        "high": 112,
        "direction": "up"
      },
      {
        "day": "2026-01-09",
        "low": 107,
        "open": 110,
        "close": 108,
        "high": 113,
        "direction": "down"
      },
      {
        "day": "2026-01-12",
        "low": 105,
        "open": 108,
        "close": 113,
        "high": 116,
        "direction": "up"
      },
      {
        "day": "2026-01-13",
        "low": 110,
        "open": 113,
        "close": 111,
        "high": 115,
        "direction": "down"
      },
      {
        "day": "2026-01-14",
        "low": 108,
        "open": 111,
        "close": 116,
        "high": 119,
        "direction": "up"
      },
      {
        "day": "2026-01-15",
        "low": 113,
        "open": 116,
        "close": 118,
        "high": 121,
        "direction": "up"
      },
      {
        "day": "2026-01-16",
        "low": 115,
        "open": 118,
        "close": 114,
        "high": 120,
        "direction": "down"
      },
      {
        "day": "2026-01-19",
        "low": 111,
        "open": 114,
        "close": 117,
        "high": 119,
        "direction": "up"
      },
      {
        "day": "2026-01-20",
        "low": 114,
        "open": 117,
        "close": 121,
        "high": 124,
        "direction": "up"
      },
      {
        "day": "2026-01-21",
        "low": 118,
        "open": 121,
        "close": 119,
        "high": 123,
        "direction": "down"
      },
      {
        "day": "2026-01-22",
        "low": 116,
        "open": 119,
        "close": 115,
        "high": 122,
        "direction": "down"
      },
      {
        "day": "2026-01-23",
        "low": 112,
        "open": 115,
        "close": 118,
        "high": 120,
        "direction": "up"
      },
      {
        "day": "2026-01-26",
        "low": 115,
        "open": 118,
        "close": 122,
        "high": 125,
        "direction": "up"
      },
      {
        "day": "2026-01-27",
        "low": 119,
        "open": 122,
        "close": 120,
        "high": 124,
        "direction": "down"
      },
      {
        "day": "2026-01-28",
        "low": 117,
        "open": 120,
        "close": 116,
        "high": 121,
        "direction": "down"
      },
      {
        "day": "2026-01-29",
        "low": 113,
        "open": 116,
        "close": 119,
        "high": 121,
        "direction": "up"
      },
      {
        "day": "2026-01-30",
        "low": 116,
        "open": 119,
        "close": 123,
        "high": 125,
        "direction": "up"
      }
    ]
  },
  "title": "20-Day Stock Candlestick Chart",
  "layer": [
    {
      "mark": {
        "type": "rule",
        "size": 1
      },
      "encoding": {
        "x": {
          "field": "day",
          "type": "ordinal"
        },
        "y": {
          "field": "low",
          "type": "quantitative",
          "scale": {
            "zero": false,
            "domain": [
              95,
              125
            ]
          },
          "axis": {
            "title": "Price"
          }
        },
        "y2": {
          "field": "high",
          "type": "quantitative"
        }
      }
    },
    {
      "mark": "bar",
      "encoding": {
        "x": {
          "field": "day",
          "type": "ordinal"
        },
        "y": {
          "field": "open",
          "type": "quantitative",
          "scale": {
            "zero": false,
            "domain": [
              95,
              125
            ]
          },
          "axis": {
            "title": "Price"
          }
        },
        "y2": {
          "field": "close",
          "type": "quantitative"
        },
        "color": {
          "field": "direction",
          "type": "nominal",
          "scale": {
            "domain": [
              "up",
              "down"
            ],
            "range": [
              "green",
              "red"
            ]
          }
        }
      }
    }
  ]
}A heatmap of server request latency: day of week on y in calendar order Mon, Tue, Wed, Thu, Fri, Sat, Sun (not alphabetical), hour of day (0–23) on x, each cell coloured by median latency in ms. Use realistic values with a weekday business-hours peak.
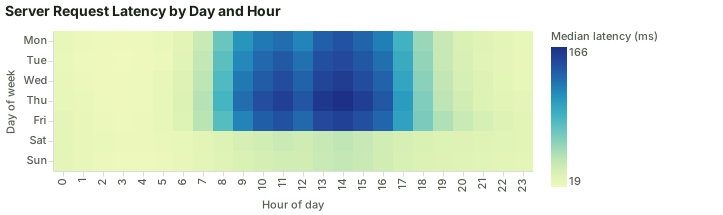
The result exactly as returned, in vega-lite — the source chart@6baf09f0 was checked against.
{
"$schema": "https://vega.github.io/schema/vega-lite/v6.json",
"name": "server_latency",
"data": {
"values": [
{
"day": "Mon",
"hour": 0,
"latency": 24
},
{
"day": "Mon",
"hour": 1,
"latency": 22
},
{
"day": "Mon",
"hour": 2,
"latency": 21
},
{
"day": "Mon",
"hour": 3,
"latency": 20
},
{
"day": "Mon",
"hour": 4,
"latency": 21
},
{
"day": "Mon",
"hour": 5,
"latency": 23
},
{
"day": "Mon",
"hour": 6,
"latency": 28
},
{
"day": "Mon",
"hour": 7,
"latency": 42
},
{
"day": "Mon",
"hour": 8,
"latency": 78
},
{
"day": "Mon",
"hour": 9,
"latency": 112
},
{
"day": "Mon",
"hour": 10,
"latency": 126
},
{
"day": "Mon",
"hour": 11,
"latency": 132
},
{
"day": "Mon",
"hour": 12,
"latency": 121
},
{
"day": "Mon",
"hour": 13,
"latency": 138
},
{
"day": "Mon",
"hour": 14,
"latency": 145
},
{
"day": "Mon",
"hour": 15,
"latency": 136
},
{
"day": "Mon",
"hour": 16,
"latency": 124
},
{
"day": "Mon",
"hour": 17,
"latency": 94
},
{
"day": "Mon",
"hour": 18,
"latency": 61
},
{
"day": "Mon",
"hour": 19,
"latency": 43
},
{
"day": "Mon",
"hour": 20,
"latency": 34
},
{
"day": "Mon",
"hour": 21,
"latency": 30
},
{
"day": "Mon",
"hour": 22,
"latency": 27
},
{
"day": "Mon",
"hour": 23,
"latency": 25
},
{
"day": "Tue",
"hour": 0,
"latency": 23
},
{
"day": "Tue",
"hour": 1,
"latency": 21
},
{
"day": "Tue",
"hour": 2,
"latency": 20
},
{
"day": "Tue",
"hour": 3,
"latency": 19
},
{
"day": "Tue",
"hour": 4,
"latency": 20
},
{
"day": "Tue",
"hour": 5,
"latency": 22
},
{
"day": "Tue",
"hour": 6,
"latency": 29
},
{
"day": "Tue",
"hour": 7,
"latency": 45
},
{
"day": "Tue",
"hour": 8,
"latency": 83
},
{
"day": "Tue",
"hour": 9,
"latency": 118
},
{
"day": "Tue",
"hour": 10,
"latency": 134
},
{
"day": "Tue",
"hour": 11,
"latency": 142
},
{
"day": "Tue",
"hour": 12,
"latency": 130
},
{
"day": "Tue",
"hour": 13,
"latency": 147
},
{
"day": "Tue",
"hour": 14,
"latency": 151
},
{
"day": "Tue",
"hour": 15,
"latency": 143
},
{
"day": "Tue",
"hour": 16,
"latency": 131
},
{
"day": "Tue",
"hour": 17,
"latency": 99
},
{
"day": "Tue",
"hour": 18,
"latency": 64
},
{
"day": "Tue",
"hour": 19,
"latency": 44
},
{
"day": "Tue",
"hour": 20,
"latency": 35
},
{
"day": "Tue",
"hour": 21,
"latency": 29
},
{
"day": "Tue",
"hour": 22,
"latency": 26
},
{
"day": "Tue",
"hour": 23,
"latency": 24
},
{
"day": "Wed",
"hour": 0,
"latency": 24
},
{
"day": "Wed",
"hour": 1,
"latency": 22
},
{
"day": "Wed",
"hour": 2,
"latency": 20
},
{
"day": "Wed",
"hour": 3,
"latency": 20
},
{
"day": "Wed",
"hour": 4,
"latency": 21
},
{
"day": "Wed",
"hour": 5,
"latency": 24
},
{
"day": "Wed",
"hour": 6,
"latency": 31
},
{
"day": "Wed",
"hour": 7,
"latency": 48
},
{
"day": "Wed",
"hour": 8,
"latency": 88
},
{
"day": "Wed",
"hour": 9,
"latency": 126
},
{
"day": "Wed",
"hour": 10,
"latency": 141
},
{
"day": "Wed",
"hour": 11,
"latency": 149
},
{
"day": "Wed",
"hour": 12,
"latency": 137
},
{
"day": "Wed",
"hour": 13,
"latency": 153
},
{
"day": "Wed",
"hour": 14,
"latency": 158
},
{
"day": "Wed",
"hour": 15,
"latency": 149
},
{
"day": "Wed",
"hour": 16,
"latency": 137
},
{
"day": "Wed",
"hour": 17,
"latency": 103
},
{
"day": "Wed",
"hour": 18,
"latency": 67
},
{
"day": "Wed",
"hour": 19,
"latency": 46
},
{
"day": "Wed",
"hour": 20,
"latency": 36
},
{
"day": "Wed",
"hour": 21,
"latency": 31
},
{
"day": "Wed",
"hour": 22,
"latency": 27
},
{
"day": "Wed",
"hour": 23,
"latency": 25
},
{
"day": "Thu",
"hour": 0,
"latency": 25
},
{
"day": "Thu",
"hour": 1,
"latency": 23
},
{
"day": "Thu",
"hour": 2,
"latency": 21
},
{
"day": "Thu",
"hour": 3,
"latency": 20
},
{
"day": "Thu",
"hour": 4,
"latency": 21
},
{
"day": "Thu",
"hour": 5,
"latency": 25
},
{
"day": "Thu",
"hour": 6,
"latency": 33
},
{
"day": "Thu",
"hour": 7,
"latency": 51
},
{
"day": "Thu",
"hour": 8,
"latency": 92
},
{
"day": "Thu",
"hour": 9,
"latency": 132
},
{
"day": "Thu",
"hour": 10,
"latency": 148
},
{
"day": "Thu",
"hour": 11,
"latency": 156
},
{
"day": "Thu",
"hour": 12,
"latency": 144
},
{
"day": "Thu",
"hour": 13,
"latency": 161
},
{
"day": "Thu",
"hour": 14,
"latency": 166
},
{
"day": "Thu",
"hour": 15,
"latency": 157
},
{
"day": "Thu",
"hour": 16,
"latency": 143
},
{
"day": "Thu",
"hour": 17,
"latency": 108
},
{
"day": "Thu",
"hour": 18,
"latency": 70
},
{
"day": "Thu",
"hour": 19,
"latency": 48
},
{
"day": "Thu",
"hour": 20,
"latency": 38
},
{
"day": "Thu",
"hour": 21,
"latency": 32
},
{
"day": "Thu",
"hour": 22,
"latency": 28
},
{
"day": "Thu",
"hour": 23,
"latency": 26
},
{
"day": "Fri",
"hour": 0,
"latency": 26
},
{
"day": "Fri",
"hour": 1,
"latency": 24
},
{
"day": "Fri",
"hour": 2,
"latency": 22
},
{
"day": "Fri",
"hour": 3,
"latency": 21
},
{
"day": "Fri",
"hour": 4,
"latency": 22
},
{
"day": "Fri",
"hour": 5,
"latency": 25
},
{
"day": "Fri",
"hour": 6,
"latency": 32
},
{
"day": "Fri",
"hour": 7,
"latency": 49
},
{
"day": "Fri",
"hour": 8,
"latency": 86
},
{
"day": "Fri",
"hour": 9,
"latency": 121
},
{
"day": "Fri",
"hour": 10,
"latency": 139
},
{
"day": "Fri",
"hour": 11,
"latency": 146
},
{
"day": "Fri",
"hour": 12,
"latency": 134
},
{
"day": "Fri",
"hour": 13,
"latency": 151
},
{
"day": "Fri",
"hour": 14,
"latency": 155
},
{
"day": "Fri",
"hour": 15,
"latency": 147
},
{
"day": "Fri",
"hour": 16,
"latency": 135
},
{
"day": "Fri",
"hour": 17,
"latency": 105
},
{
"day": "Fri",
"hour": 18,
"latency": 72
},
{
"day": "Fri",
"hour": 19,
"latency": 53
},
{
"day": "Fri",
"hour": 20,
"latency": 42
},
{
"day": "Fri",
"hour": 21,
"latency": 36
},
{
"day": "Fri",
"hour": 22,
"latency": 31
},
{
"day": "Fri",
"hour": 23,
"latency": 28
},
{
"day": "Sat",
"hour": 0,
"latency": 27
},
{
"day": "Sat",
"hour": 1,
"latency": 25
},
{
"day": "Sat",
"hour": 2,
"latency": 23
},
{
"day": "Sat",
"hour": 3,
"latency": 22
},
{
"day": "Sat",
"hour": 4,
"latency": 22
},
{
"day": "Sat",
"hour": 5,
"latency": 23
},
{
"day": "Sat",
"hour": 6,
"latency": 25
},
{
"day": "Sat",
"hour": 7,
"latency": 28
},
{
"day": "Sat",
"hour": 8,
"latency": 32
},
{
"day": "Sat",
"hour": 9,
"latency": 36
},
{
"day": "Sat",
"hour": 10,
"latency": 39
},
{
"day": "Sat",
"hour": 11,
"latency": 42
},
{
"day": "Sat",
"hour": 12,
"latency": 40
},
{
"day": "Sat",
"hour": 13,
"latency": 44
},
{
"day": "Sat",
"hour": 14,
"latency": 47
},
{
"day": "Sat",
"hour": 15,
"latency": 43
},
{
"day": "Sat",
"hour": 16,
"latency": 39
},
{
"day": "Sat",
"hour": 17,
"latency": 36
},
{
"day": "Sat",
"hour": 18,
"latency": 34
},
{
"day": "Sat",
"hour": 19,
"latency": 32
},
{
"day": "Sat",
"hour": 20,
"latency": 31
},
{
"day": "Sat",
"hour": 21,
"latency": 30
},
{
"day": "Sat",
"hour": 22,
"latency": 29
},
{
"day": "Sat",
"hour": 23,
"latency": 28
},
{
"day": "Sun",
"hour": 0,
"latency": 26
},
{
"day": "Sun",
"hour": 1,
"latency": 24
},
{
"day": "Sun",
"hour": 2,
"latency": 22
},
{
"day": "Sun",
"hour": 3,
"latency": 21
},
{
"day": "Sun",
"hour": 4,
"latency": 21
},
{
"day": "Sun",
"hour": 5,
"latency": 22
},
{
"day": "Sun",
"hour": 6,
"latency": 24
},
{
"day": "Sun",
"hour": 7,
"latency": 27
},
{
"day": "Sun",
"hour": 8,
"latency": 30
},
{
"day": "Sun",
"hour": 9,
"latency": 34
},
{
"day": "Sun",
"hour": 10,
"latency": 37
},
{
"day": "Sun",
"hour": 11,
"latency": 39
},
{
"day": "Sun",
"hour": 12,
"latency": 38
},
{
"day": "Sun",
"hour": 13,
"latency": 42
},
{
"day": "Sun",
"hour": 14,
"latency": 45
},
{
"day": "Sun",
"hour": 15,
"latency": 42
},
{
"day": "Sun",
"hour": 16,
"latency": 38
},
{
"day": "Sun",
"hour": 17,
"latency": 35
},
{
"day": "Sun",
"hour": 18,
"latency": 33
},
{
"day": "Sun",
"hour": 19,
"latency": 31
},
{
"day": "Sun",
"hour": 20,
"latency": 30
},
{
"day": "Sun",
"hour": 21,
"latency": 29
},
{
"day": "Sun",
"hour": 22,
"latency": 28
},
{
"day": "Sun",
"hour": 23,
"latency": 27
}
]
},
"title": "Server Request Latency by Day and Hour",
"mark": "rect",
"encoding": {
"x": {
"field": "hour",
"type": "ordinal",
"axis": {
"title": "Hour of day"
}
},
"y": {
"field": "day",
"type": "ordinal",
"scale": {
"domain": [
"Mon",
"Tue",
"Wed",
"Thu",
"Fri",
"Sat",
"Sun"
]
},
"axis": {
"title": "Day of week"
}
},
"color": {
"field": "latency",
"type": "quantitative",
"legend": {
"title": "Median latency (ms)"
}
}
}
}The same list over HTTP is GET /v1/oracles.
Names are domain words
You ask the chart oracle, the vector-graphics oracle or the coverage-policy
oracle — named for what you want, not for what produces it.
That is a deliberate boundary. You are buying an answer about charts. What sits behind the name is ours to change, and nothing about it appears in the name or in the response, so an integration of yours cannot come to depend on it and then break when we improve it.
Formats
An oracle declares the formats it can produce. Pass format to choose one; omit
it for default_format.
Asking for a format an oracle cannot produce is refused and the refusal names the ones it can. That is the one error an agent can act on without a human, which is why it is shaped that way rather than as a bare rejection.
A format is not always a superset of the others
Formats of the same oracle are not equally expressive. A request that succeeds for one can be refused for another — the refusal is about what that format can express, never about whether your request was reasonable.
chart is the live example. vega-lite expresses the most; gnuplot expresses
less, and refuses rather than quietly dropping what it cannot carry — time axes,
values it would have to fetch rather than be given, and transformations that
happen before plotting rather than during it.
plotly, echarts and chartjs return a document for that library — a Plotly
figure, an ECharts option, a Chart.js configuration — with every number already
computed, so the same chart shows the same values in all of them. Because the numbers are computed
before you receive them, all three need the data inline and refuse a chart whose
values are at an address. Beyond that:
| Format | Also refuses |
|---|---|
plotly |
trails, maps, images, small multiples (row, column) of anything but bars, lines, areas and points or split by dates or numbers, a radial value that is negative or falls outside the circle, an arc layered with another mark or with arcs on other scales, a shape on anything but a point or read from an ordered field, a size on anything but a point, an opacity on anything but a point or a bar, a size or opacity read from unordered categories, a range of colours on a numeric colour, colour on two channels at once, and a range between dates written with a time zone |
echarts |
the same, axis format strings, a bar or band running between two dates, and a bar ranged along x unless y is a category |
chartjs |
the same as echarts (except bars ranged along x), and box plots, heatmaps, text labels, a colour scale, a line across the whole plot, a range along a date axis, a second view or a band beside a colour legend (except a layer of arcs), an rgb() or hsl() colour on anything drawn below full opacity, and small multiples |
Where a format cannot carry something without refusing the whole chart, the
answer says so as a warning: echarts and chartjs take their width and height
from the page, and chartjs draws a time axis as categories.
A refusal of this kind still costs a credit. Deciding that something cannot be rendered is the work — the same work as deciding it can. The table above is here so that is a known limit rather than something you discover one credit at a time.
vector-graphics has the same shape across its three formats. tikz and metapost
express the most; pictex expresses less and refuses rather than approximating
— it has no arbitrary stroke colours, no fills, and no coloured text, and it
names which of those you asked for.
vector-graphics computes the geometry
Describe a figure by what it is, not by where each mark goes: the midpoint of two points, where two lines meet, a point partway along a ray, a circle tangent to a line, a line perpendicular to another, a length equal to a distance. The coordinates in the TikZ you get back are computed for you.
Say in your intent what the figure must show — three points collinear, two
lines perpendicular — and it is checked. A figure that cannot show it comes back
invalid, naming what failed and by how much, rather than looking right and
being wrong.
A returned figure is fitted to its canvas, with labels clear of the lines, trees and rows of boxes laid out from their text, and one consistent style: construction lines in grey, extensions dashed, the subject in a heavier line, fills tinted with matching outlines.
Some figures need things vector-graphics does not draw: colour gradients, embedded
images, animation, fill patterns, transparency or shading. A request that cannot
be drawn without one is answered invalid with detail naming the feature,
instead of an approximation. See Verdicts.
vector-graphics returns source, not a picture
The chart formats return a document something else can draw. The
vector-graphics
formats return TeX-family source — tikz, pictex and metapost are all
things you typeset. You get a fragment to place in a document, not an image. To
see it drawn, a valid answer carries a figure token — see
Draw a figure.
Two real answers from vector-graphics, with the TikZ each one returned:
A right triangle with legs 3 and 4 and hypotenuse 5, each side labelled with its length, and the right angle marked with a small square.
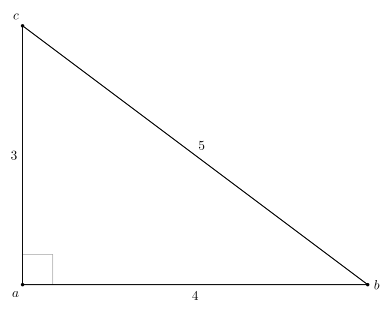
The result exactly as returned, in tikz — the source vector-graphics@c738bf88 was checked against.
\begin{tikzpicture}[x=1pt,y=1pt]
  \path[use as bounding box] (0,0) rectangle (294.56,234.83);
  \draw[draw=black!45,line width=0.4pt] (39.75,20.5) -- (39.75,43.25) -- (17,43.25);
  \draw[draw=black,line width=0.6pt,fill=none] (17,20.5) -- (277,20.5) -- (17,215.5) -- cycle;
  \draw[draw=black,line width=0.6pt] (17,20.5) -- (277,20.5);
  \draw[draw=black,line width=0.6pt] (17,20.5) -- (17,215.5);
  \draw[draw=black,line width=0.6pt] (277,20.5) -- (17,215.5);
  \filldraw[draw=none,line width=0.4pt,fill=black] (17,20.5) circle[radius=1.3pt];
  \filldraw[draw=none,line width=0.4pt,fill=black] (277,20.5) circle[radius=1.3pt];
  \filldraw[draw=none,line width=0.4pt,fill=black] (17,215.5) circle[radius=1.3pt];
  \node[text=black,anchor=center,font=\fontsize{10pt}{12pt}\selectfont] at (11.67,13.42) {$a$};
  \node[text=black,anchor=center,font=\fontsize{10pt}{12pt}\selectfont] at (283.78,20.5) {$b$};
  \node[text=black,anchor=center,font=\fontsize{10pt}{12pt}\selectfont] at (11.95,222.58) {$c$};
  \node[text=black,anchor=center,font=\fontsize{10pt}{12pt}\selectfont] at (147,12.25) {4};
  \node[text=black,anchor=center,font=\fontsize{10pt}{12pt}\selectfont] at (10.5,118) {3};
  \node[text=black,anchor=center,font=\fontsize{10pt}{12pt}\selectfont] at (151.9,125.45) {5};
\end{tikzpicture}
An angle of 40 degrees on the unit circle: the circle, the x-axis, a radius at 40 degrees, the arc between the x-axis and the radius marked, and the angle labelled 40°.
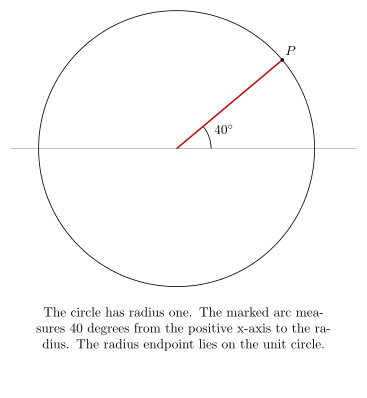
The result exactly as returned, in tikz — the source vector-graphics@c738bf88 was checked against.
\begin{tikzpicture}[x=1pt,y=1pt]
  \path[use as bounding box] (0,0) rectangle (276,274);
  \draw[draw=black!45,line width=0.4pt] (8,162) -- (268,162);
  \draw[draw=black,line width=0.6pt,fill=none] (132.8,162) circle[radius=104pt];
  \draw[draw=black,line width=0.6pt] (158.8,162) -- (158.77,163.3) -- (158.67,164.59) -- (158.51,165.88) -- (158.28,167.15) -- (158,168.42) -- (157.64,169.66) -- (157.23,170.89) -- (156.76,172.1) -- (156.23,173.28) -- (155.63,174.43) -- (154.99,175.56) -- (154.28,176.65) -- (153.53,177.7) -- (152.72,178.71);
  \draw[draw=red!75!black,line width=1.1pt] (132.8,162) -- (212.47,228.85);
  \filldraw[draw=none,line width=0.4pt,fill=black] (212.47,228.85) circle[radius=1.3pt];
  \node[text=black,anchor=center,font=\fontsize{10pt}{12pt}\selectfont] at (218.7,235.93) {$P$};
  \node[text=black,anchor=center,font=\fontsize{10pt}{12pt}\selectfont] at (168.46,176.6) {40\ensuremath{^\circ}};
  \node[text=black,anchor=center,font=\fontsize{10pt}{12pt}\selectfont,text width=260pt,align=center] at (138,26) {The circle has radius one. The marked arc measures 40 degrees from the positive x-axis to the radius. The radius endpoint lies on the unit circle.};
\end{tikzpicture}
coverage-policy answers questions about a coverage policy, as JSON
coverage-policy takes a question about the Medicare Local Coverage
Determination for total knee arthroplasty (LCD L36575, version 21), such as
"Can I get a knee replacement if I'm under 65?", and returns the parts of that
policy that answer it: the rules, the named conditions and statements they rely
on, and the policy passage each part comes from. Every entry in an answer is
taken from the policy; nothing is written for the question. It records what the
policy says; it does not decide whether a patient qualifies.
Its format, lookup, is a document: result is an object, and a valid answer
carries no figure block. The object's keys are policy, review, asked,
not_found, scope, rules, conditions, statements, reason_topics,
notes, passages, examples, open_questions, other_documents and
source_passages.
askedsays, in words, which parts of the policy were looked up.not_foundlists the searches that found no entry and the questions no rule answers. Search matches exact words, so a search for "X-rays" finds nothing in a policy that says "radiography". A question about something the policy is silent on, such as an age limit, gets an entry here rather than a guess.- An entry names the passages it cites under
sources, by id, andsource_passagesholds each passage's pages, section and words. reviewsays how far the policy's representation has been reviewed. Today it is a draft that has not had clinical review.
Send "views": ["summary"] with the question to also get the answer as text
a person can read, in views.summary. It is built from result alone: each
rule and condition by name with its pages, the lists of what must be true, the
policy's own wording quoted, what the policy does not mention, and the review
note. It never names an entry by its id. For "Can I get a knee replacement if
I'm under 65?" it begins:
From Total Knee Arthroplasty (LCD L36575 version 21; revision effective 2025-11-06).

The policy does not mention "age" or "65".

Indications for a first total replacement (indication, pages 7, 8)
The policy says: "Noridian will consider total knee replacement surgery medically necessary in the following circumstances:"
For a first total knee replacement.
It applies when any one of these is true:
- The advanced joint disease pathway (explained below)
- Failure of a previous osteotomy
- Distal femur fracture
A question about another policy or another procedure is still answered from this one policy: the answer is what LCD L36575 says, which may not be what was asked about.
Callers that send format: "json" still get the earlier answer for a passage of
a policy (its scope, rules, conditions and statements). That format is no longer
listed and will be retired.
What result holds
A format that produces a document returns it decoded — result is an object.
A format that produces a script or plain text returns it as a string. You
already know which, because you named the format and the response echoes it back
beside the result.
Every plan, every oracle
Nothing is gated by tier. An agent that cannot rely on a tool being there stops reaching for it, so what a plan buys is volume, never access.
New oracles
They appear in GET /v1/oracles and in the console — with no change on
your side. If your integration reads the catalogue at start-up rather than
hardcoding names, that is all it takes.