Get started
Introduction
Ask for a chart or a figure in plain language. Get it back checked, or get a plain no.
Forma is an API and an MCP server that turns a request in plain language into a
chart or a figure you can use directly — Vega-Lite, Plotly, ECharts, Chart.js or
gnuplot for a chart; TikZ, PicTeX or MetaPost for a figure. Forma checks every artifact against a versioned set of rules before it reaches you.
So instead of checking it yourself, you get an artifact that passed, with the
version of the rules it passed — or invalid, with the reason. The rules
themselves are not published.
It checks form, not meaning: a valid chart of the wrong column is still valid.
You ask an oracle — chart, vector-graphics or coverage-policy — see Oracles.
The quickest way to try it is from the assistant you already use:
Connect Forma to your assistant
One URL, no API key — you sign in with your Forma account in the browser. You need an account first, and to have opened the console once: signing in from an agent never creates one. Asking an oracle still spends credits.
https://mcp.formalogic.io/mcpSteps for your client


Or paste one prompt into any agent
Connect to Forma, a remote MCP server at https://mcp.formalogic.io/mcp. Add it as a remote HTTP MCP server named "forma" with no API key: it uses OAuth, so I will sign in with my Forma account in the browser when you connect. If you need the exact steps for this client, read https://docs.formalogic.io/connect. Once connected, call forma_status and tell me which account you are connected as, then call list_oracles to show what you can ask.Calling it from code instead? Start with the Quickstart.
What comes back
Every call returns a verdict — valid, invalid or error. A valid one
carries a citation, verified_by, identifying the version of the rules it passed. Below are real
answers exactly as returned, each picture beside the source code it was drawn
from. What each verdict means is on Verdicts.
A candlestick chart of a stock over 20 trading days: a thin rule from low to high and a bar from open to close for each day, green when close is above open and red when below. The price axis must not start at zero; scale it to the price range (about 95 to 125) so the candles are tall and readable.
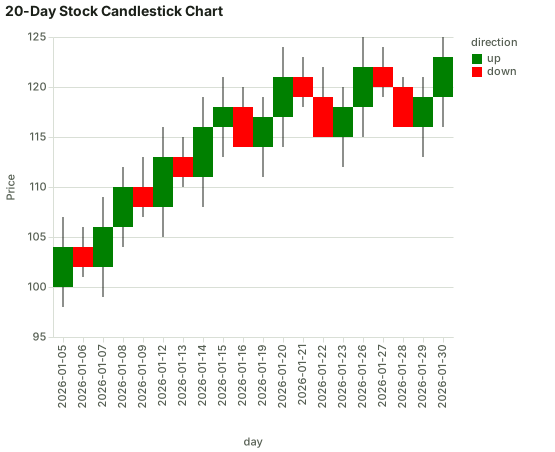
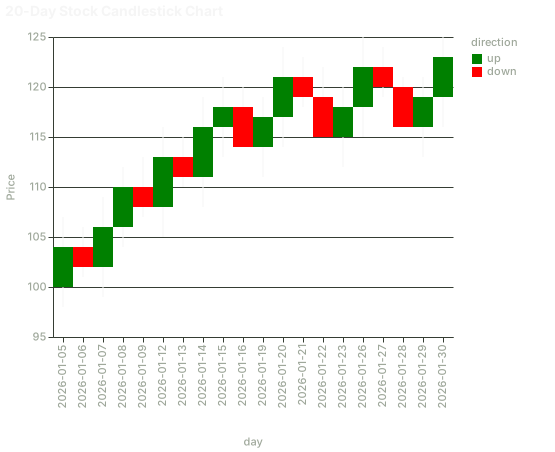
The result exactly as returned, in vega-lite — the source chart@6baf09f0 was checked against.
{
  "$schema": "https://vega.github.io/schema/vega-lite/v6.json",
  "name": "stock_candlestick",
  "data": {
    "values": [
      {
        "day": "2026-01-05",
        "low": 98,
        "open": 100,
        "close": 104,
        "high": 107,
        "direction": "up"
      },
      {
        "day": "2026-01-06",
        "low": 101,
        "open": 104,
        "close": 102,
        "high": 106,
        "direction": "down"
      },
      {
        "day": "2026-01-07",
        "low": 99,
        "open": 102,
        "close": 106,
        "high": 109,
        "direction": "up"
      },
      {
        "day": "2026-01-08",
        "low": 104,
        "open": 106,
        "close": 110,
        "high": 112,
        "direction": "up"
      },
      {
        "day": "2026-01-09",
        "low": 107,
        "open": 110,
        "close": 108,
        "high": 113,
        "direction": "down"
      },
      {
        "day": "2026-01-12",
        "low": 105,
        "open": 108,
        "close": 113,
        "high": 116,
        "direction": "up"
      },
      {
        "day": "2026-01-13",
        "low": 110,
        "open": 113,
        "close": 111,
        "high": 115,
        "direction": "down"
      },
      {
        "day": "2026-01-14",
        "low": 108,
        "open": 111,
        "close": 116,
        "high": 119,
        "direction": "up"
      },
      {
        "day": "2026-01-15",
        "low": 113,
        "open": 116,
        "close": 118,
        "high": 121,
        "direction": "up"
      },
      {
        "day": "2026-01-16",
        "low": 115,
        "open": 118,
        "close": 114,
        "high": 120,
        "direction": "down"
      },
      {
        "day": "2026-01-19",
        "low": 111,
        "open": 114,
        "close": 117,
        "high": 119,
        "direction": "up"
      },
      {
        "day": "2026-01-20",
        "low": 114,
        "open": 117,
        "close": 121,
        "high": 124,
        "direction": "up"
      },
      {
        "day": "2026-01-21",
        "low": 118,
        "open": 121,
        "close": 119,
        "high": 123,
        "direction": "down"
      },
      {
        "day": "2026-01-22",
        "low": 116,
        "open": 119,
        "close": 115,
        "high": 122,
        "direction": "down"
      },
      {
        "day": "2026-01-23",
        "low": 112,
        "open": 115,
        "close": 118,
        "high": 120,
        "direction": "up"
      },
      {
        "day": "2026-01-26",
        "low": 115,
        "open": 118,
        "close": 122,
        "high": 125,
        "direction": "up"
      },
      {
        "day": "2026-01-27",
        "low": 119,
        "open": 122,
        "close": 120,
        "high": 124,
        "direction": "down"
      },
      {
        "day": "2026-01-28",
        "low": 117,
        "open": 120,
        "close": 116,
        "high": 121,
        "direction": "down"
      },
      {
        "day": "2026-01-29",
        "low": 113,
        "open": 116,
        "close": 119,
        "high": 121,
        "direction": "up"
      },
      {
        "day": "2026-01-30",
        "low": 116,
        "open": 119,
        "close": 123,
        "high": 125,
        "direction": "up"
      }
    ]
  },
  "title": "20-Day Stock Candlestick Chart",
  "layer": [
    {
      "mark": {
        "type": "rule",
        "size": 1
      },
      "encoding": {
        "x": {
          "field": "day",
          "type": "ordinal"
        },
        "y": {
          "field": "low",
          "type": "quantitative",
          "scale": {
            "zero": false,
            "domain": [
              95,
              125
            ]
          },
          "axis": {
            "title": "Price"
          }
        },
        "y2": {
          "field": "high",
          "type": "quantitative"
        }
      }
    },
    {
      "mark": "bar",
      "encoding": {
        "x": {
          "field": "day",
          "type": "ordinal"
        },
        "y": {
          "field": "open",
          "type": "quantitative",
          "scale": {
            "zero": false,
            "domain": [
              95,
              125
            ]
          },
          "axis": {
            "title": "Price"
          }
        },
        "y2": {
          "field": "close",
          "type": "quantitative"
        },
        "color": {
          "field": "direction",
          "type": "nominal",
          "scale": {
            "domain": [
              "up",
              "down"
            ],
            "range": [
              "green",
              "red"
            ]
          }
        }
      }
    }
  ]
}A right triangle with legs 3 and 4 and hypotenuse 5, each side labelled with its length, and the right angle marked with a small square.
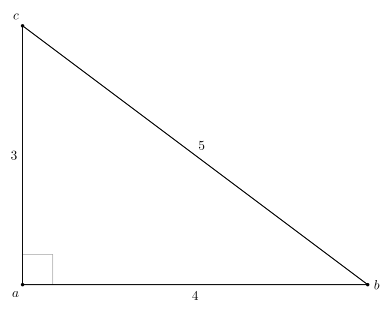
The result exactly as returned, in tikz — the source vector-graphics@c738bf88 was checked against.
\begin{tikzpicture}[x=1pt,y=1pt]
  \path[use as bounding box] (0,0) rectangle (294.56,234.83);
  \draw[draw=black!45,line width=0.4pt] (39.75,20.5) -- (39.75,43.25) -- (17,43.25);
  \draw[draw=black,line width=0.6pt,fill=none] (17,20.5) -- (277,20.5) -- (17,215.5) -- cycle;
  \draw[draw=black,line width=0.6pt] (17,20.5) -- (277,20.5);
  \draw[draw=black,line width=0.6pt] (17,20.5) -- (17,215.5);
  \draw[draw=black,line width=0.6pt] (277,20.5) -- (17,215.5);
  \filldraw[draw=none,line width=0.4pt,fill=black] (17,20.5) circle[radius=1.3pt];
  \filldraw[draw=none,line width=0.4pt,fill=black] (277,20.5) circle[radius=1.3pt];
  \filldraw[draw=none,line width=0.4pt,fill=black] (17,215.5) circle[radius=1.3pt];
  \node[text=black,anchor=center,font=\fontsize{10pt}{12pt}\selectfont] at (11.67,13.42) {$a$};
  \node[text=black,anchor=center,font=\fontsize{10pt}{12pt}\selectfont] at (283.78,20.5) {$b$};
  \node[text=black,anchor=center,font=\fontsize{10pt}{12pt}\selectfont] at (11.95,222.58) {$c$};
  \node[text=black,anchor=center,font=\fontsize{10pt}{12pt}\selectfont] at (147,12.25) {4};
  \node[text=black,anchor=center,font=\fontsize{10pt}{12pt}\selectfont] at (10.5,118) {3};
  \node[text=black,anchor=center,font=\fontsize{10pt}{12pt}\selectfont] at (151.9,125.45) {5};
\end{tikzpicture}